Follow This One Crucial Stat to Know When to Buy a Home (Hint, it’s not time yet!)
July 28, 2022
In all markets, prices move based on supply and demand. Real estate is no different. Real estate is a slower-moving market compared to, for example, the stock market or crypto. This makes it easier to stay ahead of the market and make better buying/selling decisions. If you have patience, it’s the easiest market in which to build wealth. So if you want to know where real estate prices are headed, you need to monitor the number of active sellers vs active buyers.
Here is a graph of active listings vs sales in the Greater Toronto Area. The dotted line in the middle is average buyer demand and the yellow line is total sales in a given month, and the red bars are active listings on the market at the end of each month.
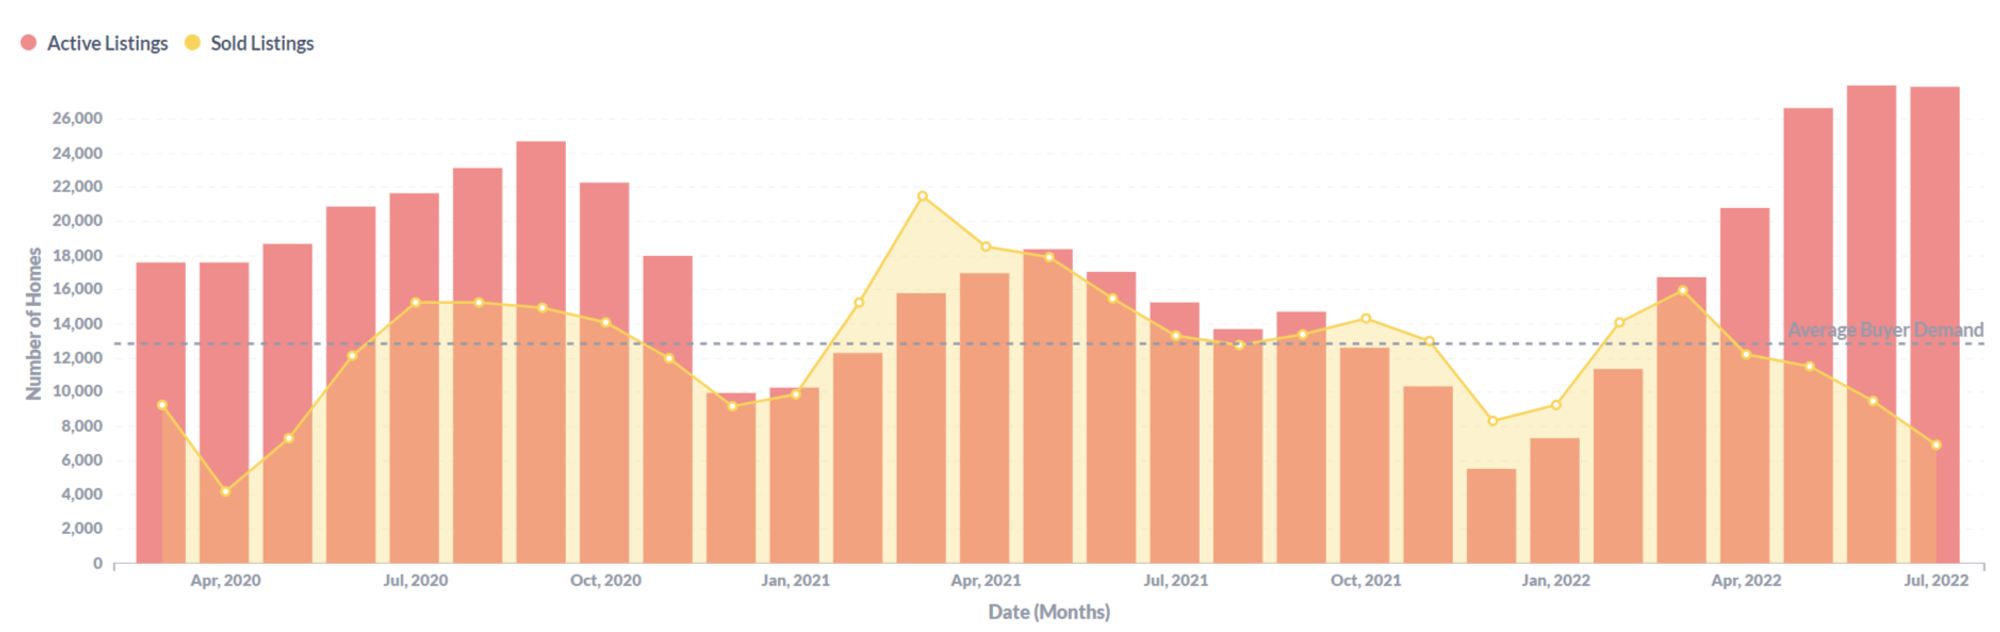
From this graph, it’s clear that we’re currently below average demand and inventory has started to pile up. This tells us what’s happening now, which is helpful, but how can we better predict what will happen in the future?
If you track absorption rates (how fast active listings are being sold in the market), you may be able stay a little ahead of the trends. This can be done by looking at the number of homes that have sold in a given period divided by active homes on the market. Traditionally, people have looked at this ratio on a monthly basis. If the ratio is between 30-60% in a month, we’re in a balanced real estate market. If it’s below 30%, we’re in a buyers’ market (a cold market with downward price pressure), since there is excessive supply that is not being absorbed by enough demand. If it’s over 60%, we’re in a sellers’ market (a hot market with fast increasing prices), since there is strong demand for the majority of the home supply on the market.
Here’s a graph of monthly absorption rate in the GTA from April 2020 to July 2022:
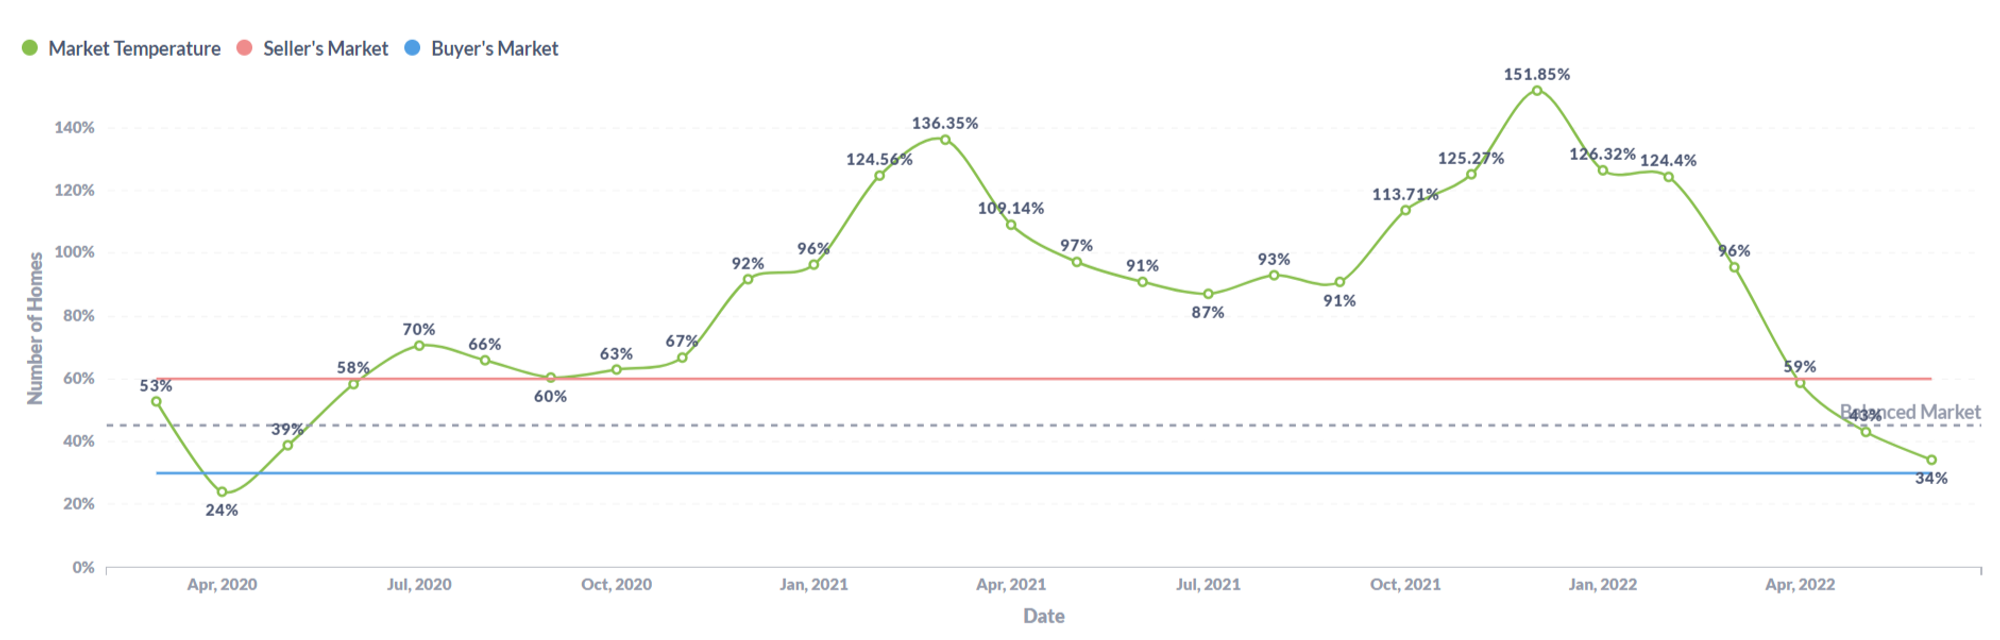
We have found that when the market absorption crosses from being in cold market territory into a balanced market territory that is a buy signal.
However, if you’re tracking this on a monthly basis, it might already be too late! The best way to see this change is to look at absorption on a weekly basis.
Here’s the same absorption rate in the GTA on a weekly basis.
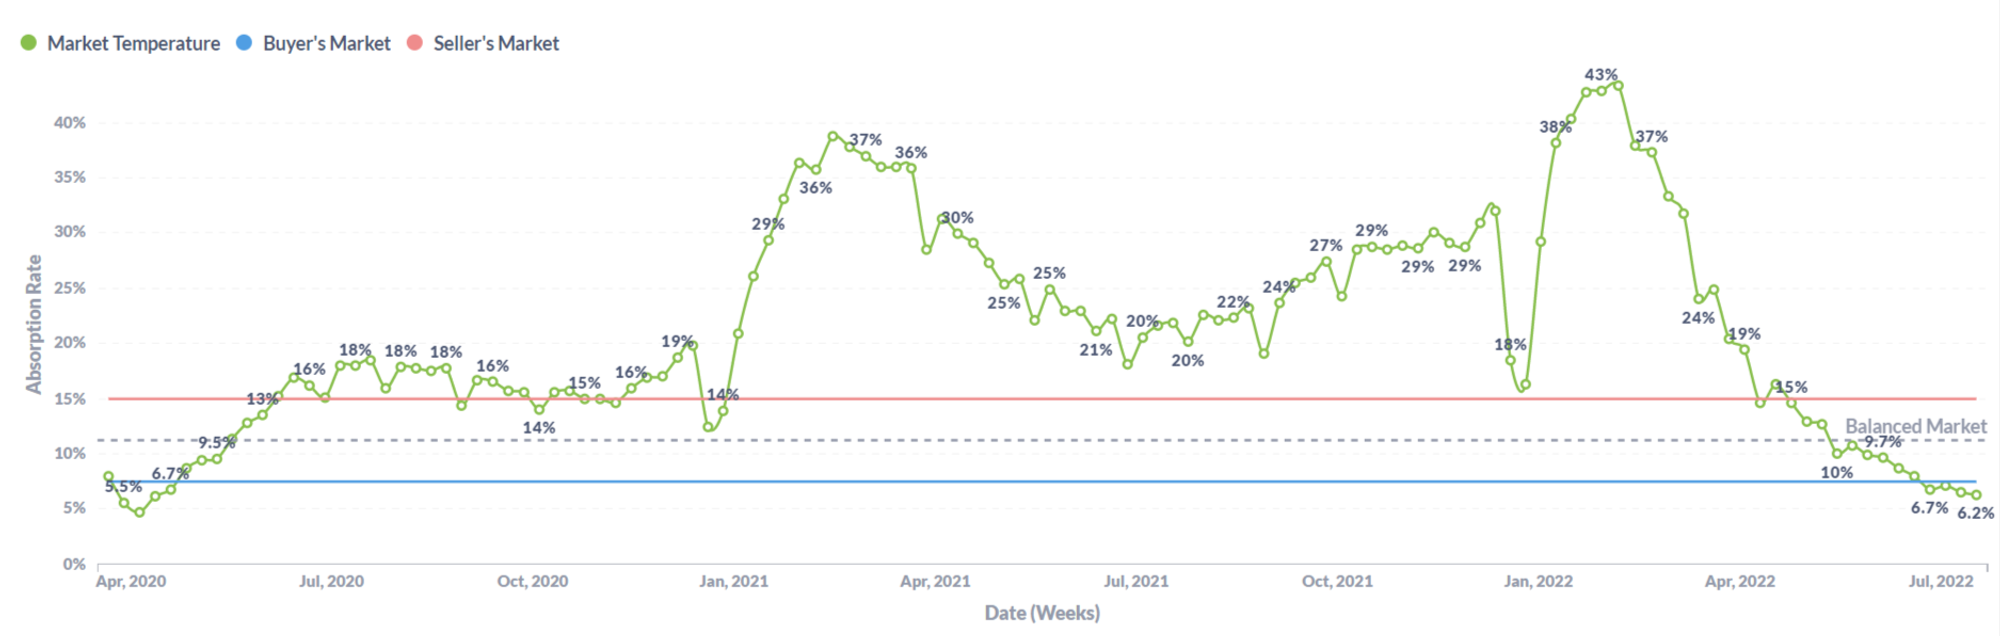
This graph showed that, by the end of April 2020, we had crossed back into balanced market territory, which we believe can be a good buy signal. The average price of a home at the end of April 2020 was approximately $840,000, by the end of May it was $945,000, and by the end of June $972,000. As an active buyer, following this statistic on a weekly basis could have saved you over $100K!
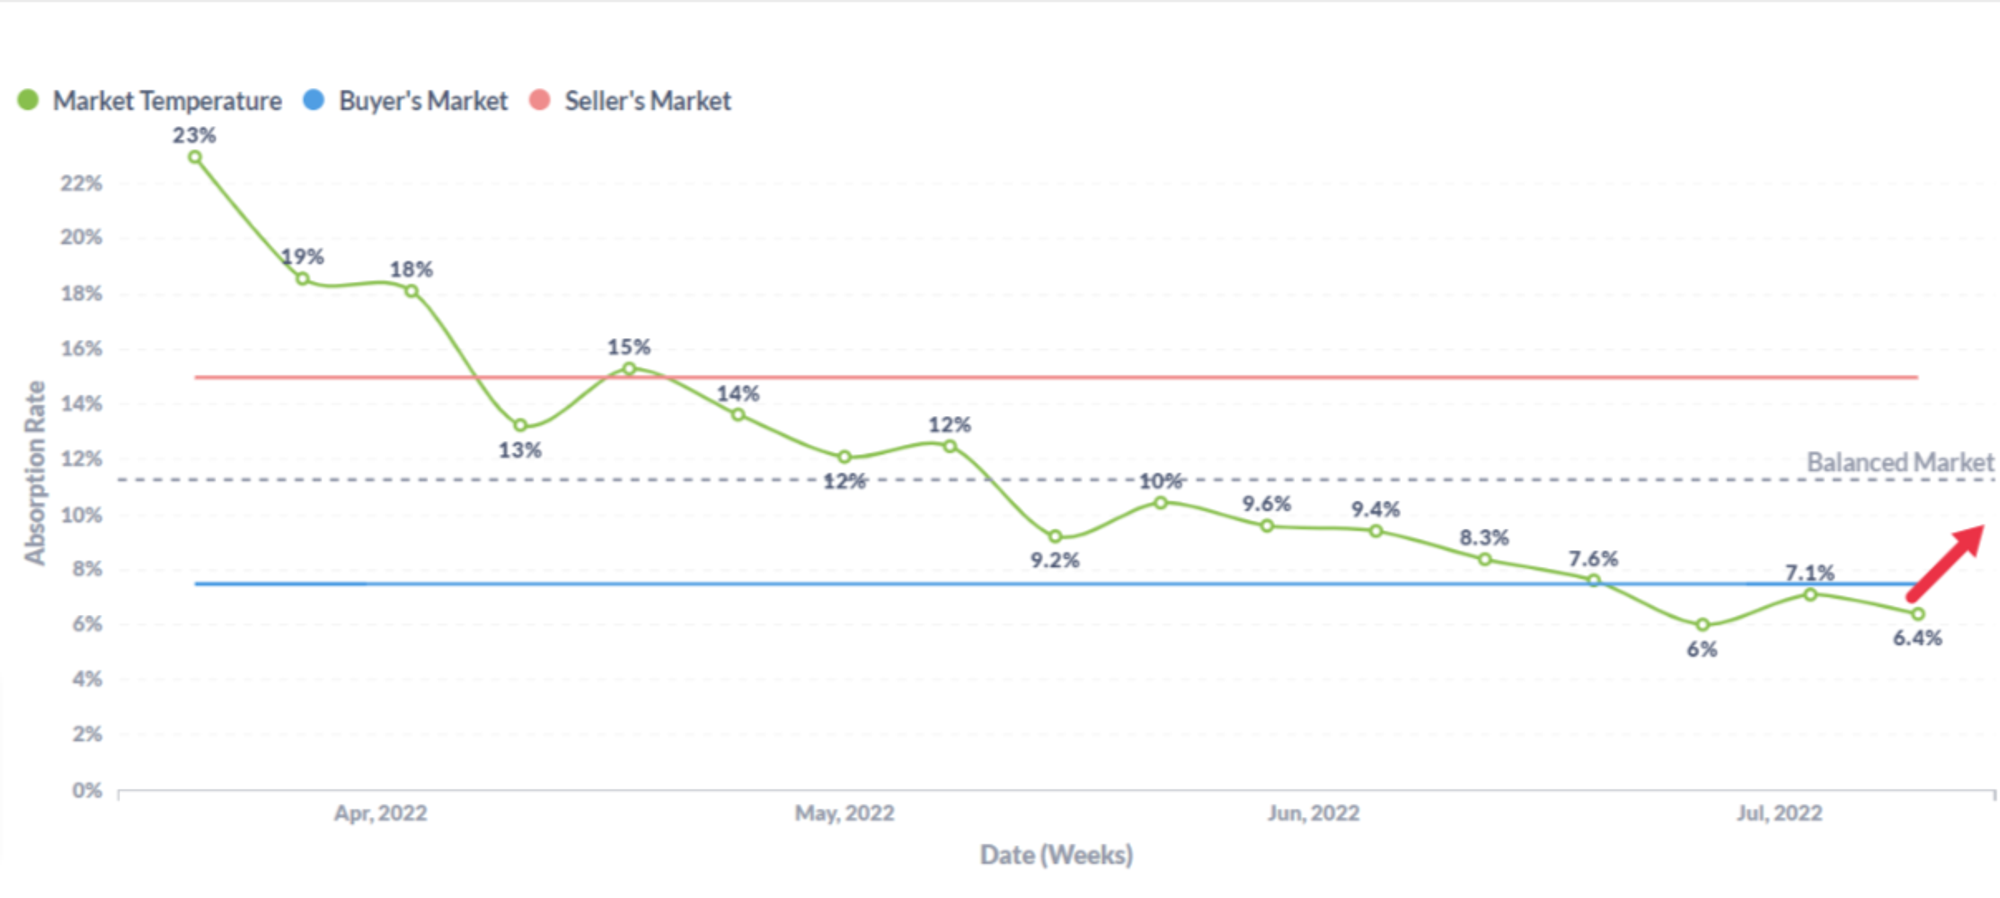
Recent months saw absorption rate drop precipitously, which has reflected in average prices dropping from $1.425M at the peak in February 2022 to $1.125M today (July).
We are bullish for the long term outlook of the GTA market (Click here to see why) and while we’re currently in cold market territory, we’re watching to see when we cross back over into balanced market territory as a great buy signal. It’s incredibly difficult to time the market. One thing is for sure, if you are going to try, you’re going to need to be ready by having a down-payment saved, having income, getting a mortgage pre-approval, and having local market knowledge.
TopHouse is one of the fastest growing Home Search Apps with with a focus on speed and user friendliness, including short video walkthroughs that make homes easy to browse. We are constantly improving our platform to help home buyers and sellers make better decisions through their home search journey.
Would you like to see a weekly market absorption rate on the TopHouse app as a feature? Let us know at info@tophouse.com
Related Posts:
This blog does not constitute investment advice and simply represents our views and observations. TopHouse's business model is not incentivized by house prices increasing or decreasing.